Create plots in seconds—voltage vs. capacity, degradation trends, full cycle analysis. AmpLabs makes it simple.
Your foundation to build your labs’ information and knowledge base.
If you’ve ever worked with battery cycling data, you know the struggle: confusing CSVs, inconsistent formats, and hours lost in messy spreadsheets or basic scripts—just to make a simple graph.
We worry about formats and data types so you can focus on the science.
AmpLabs isn’t just another plotting tool. It’s a smart, streamlined platform designed to simplify battery cycling data so you can focus on what really matters: the science. We remove the busywork, organize the mess, and help you get straight to analysis.
Product
You shouldn’t need to be a Python expert or a spreadsheet wizard to make sense of your data. AmpLabs takes care of the manual work so you can focus on real innovation.
Join the researchers already using AmpLabs to streamline their battery science workflows and get more done, faster.
From Data Chaos to Discovery—Effortlessly
Regardless of your battery test equipment —be it Neware, BioLogic, Arbin, or Maccor —simply your data with AmpLabs. No contortions, no scripting—merely drag, drop, transcend. With some organizations maintaining more than one brand of cycler, there is no easy way to easily understand and visualize all of their data.
Create plots in seconds—voltage vs. capacity, degradation trends, full cycle analysis. AmpLabs makes it simple.
Whether you’re analyzing a single cell or large-scale fleet tests, AmpLabs turns raw files into clean, ready-to-use data. Easily integrate with Jupyter, APIs, or custom AI tools—stay flexible and focused with accurate, organized results.
Voltage vs. capacity, degradation trends, full cycle analysis. AmpLabs makes it simple.
From Data Chaos to Discovery—Effortlessly
Regardless of your battery test equipment —be it Neware, BioLogic, Arbin, or Maccor —simply your data with AmpLabs. No contortions, no scripting—merely drag, drop, transcend. With some organizations maintaining more than one brand of cycler, there is no easy way to easily understand and visualize all of their data.
Create plots in seconds—voltage vs. capacity, degradation trends, full cycle analysis. AmpLabs makes it simple.
Whether you’re analyzing a single cell or large-scale fleet tests, AmpLabs turns raw files into clean, ready-to-use data. Easily integrate with Jupyter, APIs, or custom tools—stay flexible and focused with accurate, organized results.
Voltage vs. capacity, degradation trends, full cycle analysis. AmpLabs makes it simple.
From battery test labs to robotics teams and AI agents, AmpLabs can easily support your team.
Battery labs use multiple test systems (Arbin, Maccor, Neware), each with its own data format—making reporting slow and inconsistent.
Challenge:
Inconsistent outputs
Manual formatting
Hard to compare results across devices
Solution:
Automated tools standardize data from all cyclers, enabling fast, consistent reporting and easy comparisons.
Impact:
Quicker, cleaner reports
Reduced manual work
Consistent results for teams and clients
Bottom Line:
Standardized reporting means faster insights, less friction, and better outcomes.
Robotics systems rely on high-performance battery cells—but comparing suppliers is tough when data is inconsistent or incomplete.
Challenge:
Inconsistent formats from suppliers
Hard-to-compare internal test results
Time-consuming manual analysis
Solution:
Automated tools standardize and visualize cycling data, making it easy to compare key metrics like cycle life, energy density, and thermal behavior across suppliers.
Impact:
Faster supplier qualification
Confident cell selection
Less time spent on data cleanup
Bottom Line:
Standardized battery analysis helps robotics teams choose the best cells—quickly and accurately.
Energy storage teams need accurate battery models to predict performance, lifespan, and safety. But raw test data is often messy—spread across formats, inconsistent, and time-consuming to clean.
Challenge:
Inconsistent test outputs (CSV, JSON, etc.)
Manual cleaning slows down workflows
Poor data quality reduces model accuracy
Solution:
A clean data pipeline automates formatting and validation, transforming raw cycling data into model-ready inputs. This accelerates development and improves predictive performance.
Impact:
80% less time spent on preprocessing
More accurate ML and physics-based models
Faster insights into degradation, SOH, and charge behavior
Easier collaboration with standardized datasets
Bottom Line:
Clean data means better models—faster. It’s the foundation for smarter battery design and simulation.
You shouldn’t need to be a Python expert or spreadsheet wizard to understand your battery data. AmpLabs handles the busywork so you can focus on real innovation.
Join the leading researchers who use AmpLabs to take their battery science to the next level.
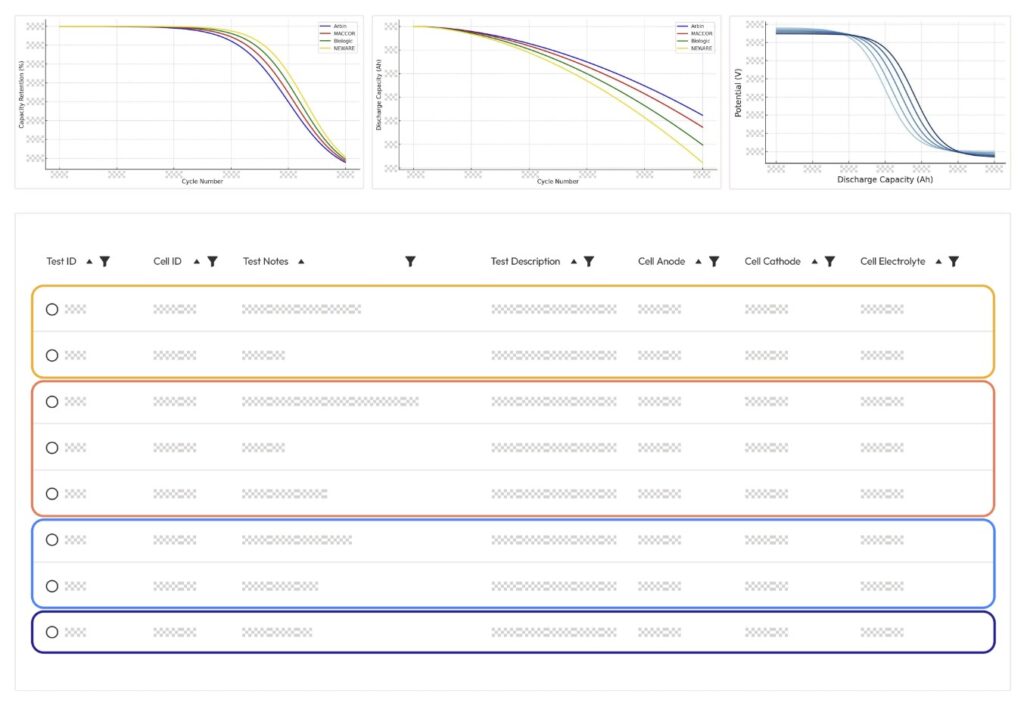
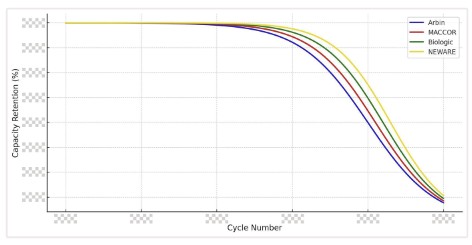
Data All in One Place
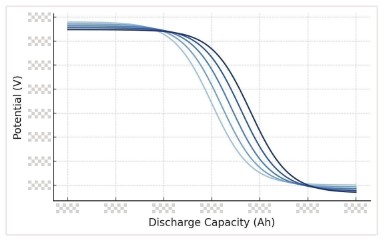
This chart presents a unified view of key battery performance metrics—such as voltage, capacity, internal resistance, and temperature—across multiple cells, test runs, or formats. By consolidating diverse datasets into a standardized format, the chart enables easy comparison, trend analysis, and cross-platform validation, streamlining insight generation from complex battery tests.
General Statistics Across Multiple Tests
This graph illustrates how a battery’s capacity changes over repeated charge-discharge cycles. The y-axis represents the retained capacity (typically as a percentage of the initial capacity), while the x-axis shows the cycle number. A downward trend indicates capacity fade over time, offering insight into cell degradation, longevity, and overall performance stability under specific test conditions.
Deep Dive Analysis
This graph displays the amount of energy a battery releases during each discharge cycle. The y-axis represents discharge capacity (typically in mAh or Ah), and the x-axis shows the cycle number or test sequence. It helps evaluate how much usable energy the cell delivers over time, offering insights into performance consistency, degradation, and overall health.